Mostrando entradas con la etiqueta Price Action. Mostrar todas las entradas

Mastering Fair Value Gaps (FVG): Your Blueprint to Smarter Trading


Understanding Fair Value Gaps (FVG)

In the intricate world of financial markets, understanding price dynamics is paramount. Fair Value Gaps, often referred to as FVGs, represent critical inefficiencies within price action that astute traders can exploit. This concept, popularized by the Inner Circle Trader (ICT) methodology, provides a unique lens through which to analyze market movements. Essentially, an FVG occurs when there's a significant and rapid price movement, leaving an imbalance between buyers and sellers. Identifying these gaps is the foundational step towards developing a robust trading strategy that capitalizes on these market inefficiencies. For any aspiring trader, a deep understanding of FVGs is not just beneficial; it's a non-negotiable component of advanced technical analysis. We'll delve into how to spot them and integrate them into your daily trading routine, aiming to elevate your return on investment (ROI).

The Art of Identifying FVGs

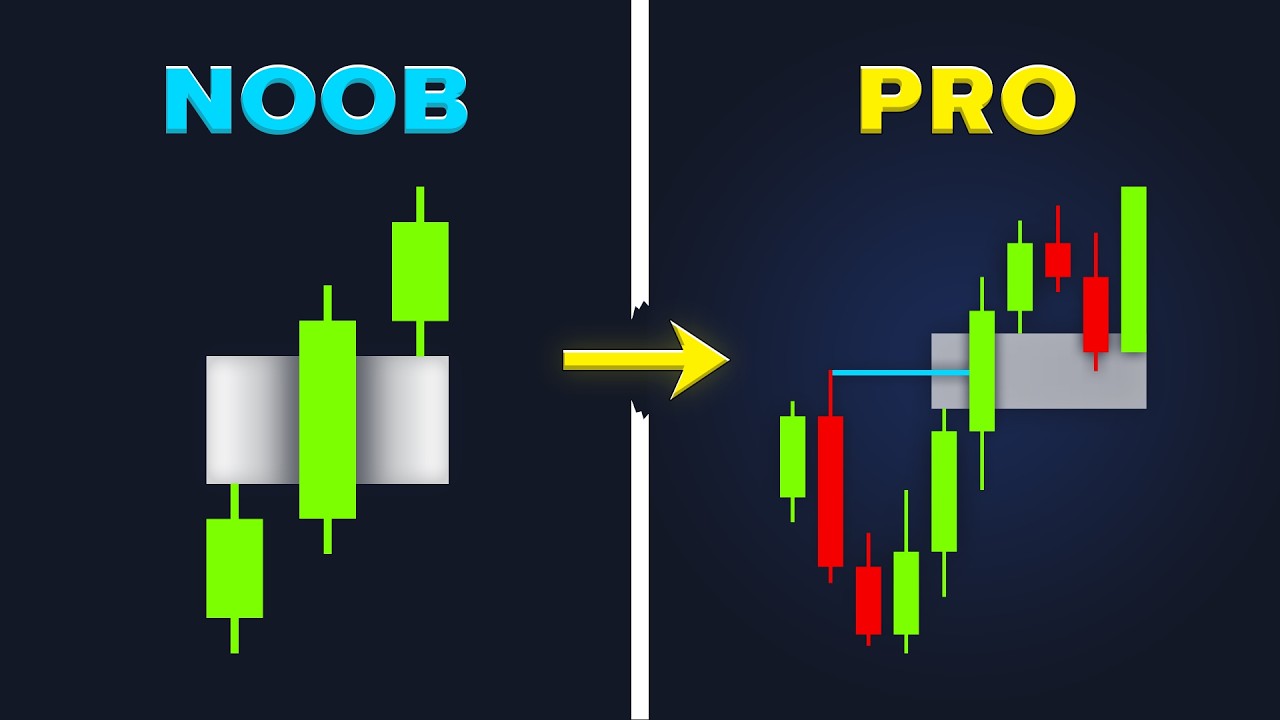
Identifying Fair Value Gaps requires a keen eye for price action and an understanding of market structure. An FVG is typically formed over a three-candle sequence. Look for a scenario where the shadow (wick) of the first candle, the body of the second candle, and the shadow of the third candle do not overlap. This creates a distinct 'gap' in the price chart, indicating a zone where liquidity was absorbed rapidly. These gaps can appear as bullish or bearish imbalances, signaling a potential for price to return to these areas. Mastery in spotting FVGs can significantly enhance your ability to pinpoint high-probability trade setups. Savvy traders understand that these zones often act as magnets for price, either to be filled or to serve as significant support or resistance levels. This precision is what separates the novices from the professionals, and it’s a skill you can develop with focused practice on charting platforms like TradingView.

"The real key to trading is not to predict the future, but to manage the risk of the present."

Implementing Your FVG Trading Strategy

Once you’ve identified a Fair Value Gap, the next critical step is implementing a trading strategy that leverages this information effectively. The core principle involves viewing the FVG as an area of expedited liquidity. A bullish FVG often suggests that price may return to fill that imbalance, presenting a buying opportunity. Conversely, a bearish FVG indicates a potential for price to retrace, offering a selling opportunity. The key is not just to spot the gap, but to understand the context. Does it align with the overall market trend? Are there other technical indicators confirming your thesis? Integrating FVG analysis with support and resistance levels, trend lines, and even order flow analysis can create incredibly powerful trade setups. This strategic integration is what elevates a simple observation into a profitable trading plan. Consider this your initial blueprint for a high-performance trading system.

Phase 1: Market Context Analysis

  • Determine the prevailing market trend (uptrend, downtrend, or consolidation).
  • Identify major support and resistance levels on your chosen timeframe.
  • Assess the overall market sentiment.

Phase 2: FVG Identification and Validation

  • Locate clear bullish or bearish Fair Value Gaps on your chart.
  • Confirm the FVG's position relative to key support/resistance or trend lines.
  • Look for confluence with other trading signals.

Phase 3: Trade Execution and Management

  • Define precise entry points, often near or within the FVG.
  • Set a stop-loss order below a bullish FVG or above a bearish FVG to mitigate risk.
  • Establish realistic take-profit targets, potentially at the next significant FVG or structural level.

Risk Management: Protecting Your Capital

Any trading strategy, no matter how sophisticated, is incomplete without a robust risk management plan. When trading with Fair Value Gaps, it’s crucial to remember that these are zones of inefficiency, not guarantees. Price can and will breach FVGs. Therefore, always employ stop-loss orders to limit potential losses. A common practice is to place your stop-loss just beyond the FVG – below the low of the FVG for a bullish setup, or above the high for a bearish setup. Furthermore, never risk more than 1-2% of your trading capital on any single trade. This discipline ensures that even a string of losing trades won't cripple your account. Effective risk management is the bedrock upon which consistent profitability is built, crucial for any investor aiming for long-term gains and capital preservation.

Risk Warning: Trading involves a significant risk of loss and is not suitable for all investors. You may lose more than your initial investment. Ensure you understand the risks involved and seek independent financial advice if necessary.

Essential Tools for FVG Traders

To effectively implement an FVG trading strategy, having the right tools is essential. High-quality charting software is non-negotiable. Platforms like TradingView offer advanced charting capabilities, allowing for precise identification of FVGs and other price action patterns. Beyond charting, reliable execution is key. Your chosen forex broker should offer tight spreads and dependable order execution to ensure your trades are placed at optimal prices, especially crucial when targeting small inefficiencies like FVGs. Automation can also play a role; while manual FVG trading is common, developing trading bots or using algorithmic trading software can help execute strategies with precision and speed that human traders might struggle to match. For those looking to delve deeper into algorithmic strategies, exploring resources on algorithmic trading and trading bots is highly recommended.

For those serious about scaling their trading operations and managing client funds, exploring forex prop firms can open doors to significant capital. These firms provide funding to traders who can demonstrate consistent profitability and risk management skills.

Maximizing Your Trading Potential with Binance

In the dynamic landscape of digital assets, platforms like Binance offer unparalleled opportunities for traders to engage with a vast array of financial instruments and innovative products. Beyond simple spot trading, Binance provides advanced tools for derivatives, staking, and yield farming, allowing you to potentially multiply your capital through strategic engagement with the crypto market. Understanding how to leverage these tools, such as using FVGs in your cryptocurrency trading strategies, can be a game-changer. Binance's ecosystem is designed to support traders of all levels, from beginners exploring their first trades to seasoned professionals managing complex portfolios. Integrating Binance into your trading arsenal can provide access to liquidity and market depth that is essential for executing strategies like FVG trading effectively. For those looking to diversify their investment portfolio beyond traditional markets, exploring the world of crypto staking and DeFi yields through a reputable platform like Binance is a logical next step.

Strategist's Verdict: Is FVG Trading for You?

Fair Value Gaps offer a sophisticated approach to market analysis that can provide a significant edge. However, they are not a magic bullet. The success of an FVG strategy hinges on your discipline, your ability to integrate it with other analytical tools, and your steadfast commitment to risk management. If you are a trader who values precision, enjoys dissecting price action, and is committed to rigorous backtesting and continuous learning, then exploring FVGs is highly recommended. It requires patience and a willingness to embrace the nuances of market structure. For those seeking a 'get rich quick' scheme, this is not it. This is a method that rewards methodical analysis and disciplined execution, much like any sound investment strategy.

"The four most expensive words in the English language are: 'This time it's different.'" - John Templeton

Your Mission: Execute Your First FVG Trade

Your Mission: Identify and Plan Your First FVG Trade

  1. Open your preferred charting platform (e.g., TradingView) and select a currency pair or asset you wish to trade.
  2. Analyze the chart on a timeframe that suits your trading style (e.g., 15-minute, 1-hour, 4-hour).
  3. Actively search for and mark at least two distinct Fair Value Gaps.
  4. For each identified FVG, hypothesize a potential trade setup: define your entry point, stop-loss level, and at least one take-profit target based on market structure.
  5. Document your findings and potential trades in a trading journal. This is crucial for learning and future refinement of your trading psychology.

This exercise will not only familiarize you with spotting FVGs but also force you to think critically about trade management and risk. Remember to start with small position sizes or even paper trading until you gain confidence.

Frequently Asked Questions (FAQ)

What is an ICT concept?

ICT (Inner Circle Trader) concepts refer to a proprietary trading methodology focusing on order flow, liquidity, market structure, and specific price action patterns like Fair Value Gaps.

Are FVGs always filled?

No, FVGs are not always filled immediately or at all. However, they often represent areas of significant market memory and can act as magnets for price, or as significant pivot points.

How do I choose the right timeframe for FVG trading?

The choice of timeframe depends on your trading style. Intraday traders might focus on 5-minute or 15-minute charts, while swing traders may prefer 1-hour, 4-hour, or daily charts. Consistency is key.

Can FVG strategies be used in any market?

Yes, FVG concepts can be applied to various markets, including Forex, stocks, cryptocurrencies, and commodities, as they are based on fundamental principles of price action and liquidity.

About the Author

The Strategist is a seasoned business consultant and market analyst with over a decade of experience helping entrepreneurs and investors maximize their profitability. His approach is data-driven, system-oriented, and focused on relentless execution.

Mastering Fair Value Gaps is a journey, not a destination. By applying these principles diligently and integrating them into a disciplined trading plan, you can significantly enhance your potential for profitability. The market is a constant negotiation of liquidity and price; understanding FVGs gives you a powerful tool to navigate this negotiation.

Mastering Breakout Strategies: The Elite Trader's Method to Sidestep False Signals and Maximize Profit


The allure of a well-executed breakout strategy is undeniable. The promise of riding a powerful price move from its inception, capturing significant gains as the market decisively moves in your favor, is what draws many traders into the arena. Yet, the path is littered with pitfalls, primarily in the form of false breakouts. These deceptive signals lure unsuspecting traders into positions that quickly reverse, leading to frustrating losses and eroded capital. This isn't about luck; it's about executing a systematic approach. This guide will equip you with the elite trader's methodology to discern genuine momentum from fleeting illusions, ensuring your trading capital is deployed with precision and confidence.

Understanding the Psychology of Breakouts

At its core, a breakout occurs when the price of an asset moves decisively beyond a defined level of resistance or support. This can happen due to a confluence of factors: news events, shifts in market sentiment, algorithmic trading activity, or simply a critical mass of traders recognizing an unsustainable price range. The psychology is simple: a confirmed breach of a significant level suggests a new trend is likely to form. However, the market is a complex ecosystem, and many participants, from institutional players to retail traders, attempt to exploit these perceived shifts. This leads to the proliferation of "fakeouts". Understanding *why* these occur is the first step to avoiding them. It's a dynamic interplay between supply and demand, where initial momentum can be quickly overwhelmed by counter-forces, leaving reversed positions in its wake.

The Illusion of Certainty: Why False Breakouts Occur

False breakouts are a systemic feature of liquid markets, not a bug. They arise from several sources:

  • Stop-Loss Hunting: Sophisticated traders may deliberately push prices into areas where a large number of stop-loss orders are expected to be placed, triggering those orders and then reversing the price to profit from the ensuing volatility. This is a critical aspect of market manipulation that every serious trader must understand.
  • Over-Leveraged Positions: When a breakout appears imminent, traders often pile in with significant leverage. If the breakout fails to gain traction, a cascade of stop-outs can accelerate the reversal.
  • News-Driven Volatility: Sudden news releases can cause sharp, short-lived price spikes that breach levels temporarily before the market digests the information and corrects.
  • Algorithmic Fluctuations: High-frequency trading algorithms can create rapid, temporary moves that mimic genuine breakouts but lack sustained underlying buying or selling pressure.

Recognizing these patterns requires moving beyond simple line-drawing on charts. It involves understanding the *intent* behind price action and the flow of real money.

The Elite Trader's Edge: Volume Confirmation and Price Action

The secret to avoiding false breakouts lies not in a single indicator, but in a holistic view of price action, critically supported by volume analysis. Genuine breakouts are characterized by:

  • Spikes in Volume: A true breakout should be accompanied by a significant increase in trading volume. This indicates strong conviction behind the move. If price breaks a level on low volume, it's a red flag.
  • Confirmation Candles: After the initial breakout candle, look for a follow-through candle that continues in the direction of the breakout, ideally closing well past the breached level and confirming the increased volume.
  • Wicks and Shadows: Be wary of breakouts that result in long upper wicks on bearish candles or long lower wicks on bullish candles just above or below a key level, respectively. These often indicate rejection.
  • Market Structure Context: Does the breakout align with the broader market trend or significant support/resistance zones? A breakout against the prevailing trend often requires much higher certainty.

For instance, when considering cryptocurrencies, observing the blockchain's transaction volume alongside exchange volume can provide a more robust confirmation. Similarly, for equities, analyzing pre-market and after-hours trading volume can offer clues to institutional sentiment.

"The market is designed to fool most people, most of the time." - Jesse Livermore

This sentiment is particularly true for breakout strategies. The masses often jump in on the initial breach, only to be met with a reversal.

Implementing the Technique: A Step-by-Step Blueprint

Here’s how to refine your breakout strategy:

Phase 1: Identification of Key Levels

Identify clear support and resistance levels, trendlines, or chart patterns (e.g., triangles, flags). These are your potential breakout zones. Use tools like TradingView (check out TradingView for charting) to draw these zones accurately.

Phase 2: Pre-Breakout Observation

Before a breakout occurs, observe the price action near these key levels. Is the price consolidating tightly? Is volume declining as price approaches the level? These are signs of building pressure.

Phase 3: The Breakout Signal

Wait for price to decisively close beyond the identified level. This means the candle body, not just the wick, should be on the "other side" of the barrier.

Phase 4: Confirmation with Volume and Subsequent Price Action

This is the critical step. Monitor the volume on the breakout candle and the candles immediately following it. If volume shows a significant spike (e.g., 1.5x to 2x the average volume over the last 20 periods) and the subsequent candle continues the move or forms a bullish/bearish engulfing pattern confirming the breach, you have strong evidence. For instance, if a stock breaks through resistance on significantly higher volume than its recent average, it's a powerful buy signal. If it breaks on low volume, it's a strong signal to stay out.

Phase 5: Entry and Stop-Loss Placement

Enter the trade on the confirmation. Place your stop-loss just below the breakout level (for a long breakout) or just above it (for a short breakout). This ensures that if the breakout proves false, your losses are contained. A tight stop-loss is non-negotiable.

Phase 6: Target Setting

Set realistic profit targets based on previous price structures, Fibonacci extensions, or a favorable risk-reward ratio (e.g., 1:2 or 1:3). For example, if you risk $100 on a trade, aim for a $200 or $300 profit.

Risk Management is Paramount: Protecting Your Capital

Even with a refined strategy, losses are inevitable. This is why robust risk management is the bedrock of successful trading. Never risk more than 1-2% of your total trading capital on any single trade. This means if you have a $10,000 account, you should not risk more than $100-$200 on a single trade. Utilizing tight stop-losses, as mentioned, is crucial for enforcing this rule. Furthermore, understanding the different types of insurance for your personal assets can provide a safety net, though it's distinct from trade-level risk management.

Risk Warning: Trading and investing in financial markets, including forex and cryptocurrencies, involves a significant risk of capital loss. Past performance is not indicative of future results. Ensure you understand these risks before trading.

Advanced Considerations and Market Nuances

While volume and price action are key, consider these additional factors:

  • Order Flow Analysis: For advanced traders, dissecting level 2 data and tape reading can reveal immediate buying or selling pressure that confirms or refutes a breakout in real-time.
  • Intermarket Analysis: How is the broader market sentiment, or related asset classes, behaving? For example, a breakout in a tech stock might be more robust if the Nasdaq is also showing strength.
  • Economic Calendar: Be acutely aware of major economic news releases (e.g., CPI, FOMC statements) as they can trigger significant volatility and false moves. Using news scanners like Benzinga can help manage this.

Different markets have different characteristics. Breakouts in volatile cryptocurrencies might require wider stop-losses than in more stable stock markets.

Maximizing Your Profits: The Binance Opportunity

For traders looking to capitalize on the explosive potential of digital assets, platforms like Binance offer a gateway to a vast array of opportunities. Beyond simple spot trading, Binance provides advanced tools for leveraged trading, futures, and staking, allowing you to deploy capital strategically. Mastering breakout strategies within the crypto market can be particularly lucrative, given its inherent volatility. By leveraging Binance' ability to execute trades rapidly and offering diverse asset choices, you can implement the breakout confirmation techniques discussed here to potentially amplify your returns. Consider exploring their advanced trading features and analytical tools to complement your strategy development. Many traders use Binance for its competitive fees and wide selection of altcoins, crucial for identifying breakout opportunities in emerging digital assets.

Strategist's Verdict: Golden Opportunity or Speculative Gamble?

The refined breakout strategy, emphasizing volume confirmation and stringent risk management, transforms a speculative gamble into a calculated opportunity. When executed with discipline, this method significantly increases the probability of capturing genuine trend movements while minimizing exposure to deceptive false signals. It requires patience, precision, and a commitment to process over impulse. For traders willing to put in the work, this is not just a strategy; it's a blueprint for consistent profitability. The true value lies in its adaptability across various markets, from forex to equities and cryptocurrencies. The key is rigorous application and unwavering adherence to the confirmation criteria.

Your Mission: Execute for Profit

The knowledge is now in your hands. The next step is action. This week, I challenge you to:

  1. Identify: Select three assets you're interested in and mark significant support and resistance levels on their charts using TradingView.
  2. Observe: Monitor these levels for potential breakouts. Look for price action and volume patterns.
  3. Execute (Simulated or Real): If a confirmed breakout occurs based on the criteria outlined, enter a trade (either live or in a simulator). Ensure your stop-loss is correctly placed.
  4. Review: At the end of the week, analyze the outcome of any trades taken. What worked? What didn't? How can you refine your approach?

The difference between a profitable trader and one who struggles is often the commitment to a repeatable, data-driven process. Master the breakout, and you master a fundamental tool for market success.

About the Author

El Estratega Financiero is a seasoned business consultant and market analyst with over a decade of experience empowering entrepreneurs and investors to maximize their profitability. Their approach is data-driven, systems-oriented, and focused on relentless execution. They specialize in deconstructing complex financial strategies into actionable, high-ROI plans.

The journey to trading mastery is a marathon, not a sprint. By implementing these refined breakout strategies and maintaining rigorous discipline, you are not just trading; you are building a system for sustainable financial growth. Continue your education, refine your edge daily, and always prioritize capital preservation. The market rewards those who are prepared and persistent.

Mastering Candlestick Patterns: Your Blueprint for Unlocking Market Insights and Boosting Trading Profits


Introduction

The financial markets whisper secrets to those who know how to listen, and nowhere is this more evident than in the nuanced language of candlestick charts. For too many aspiring traders and investors, they remain a cryptic puzzle, a mere decoration on their screens. Yet, the truth is that each candlestick is a micro-narrative, a battleground where buyers and sellers clash, and the outcome tells a powerful story about market control. Lacking this fundamental understanding is like navigating a minefield blindfolded – it's a recipe for avoidable losses and missed opportunities. This is not about luck; it's about leveraging deep knowledge of price action to inform your investment decisions. By mastering candlestick interpretation, you transform from a passive observer into an active participant, strategically positioned to capitalize on market momentum.

Why Candlesticks Matter: The Foundation of Market Psychology

The genesis of understanding market dynamics lies in recognizing the fundamental forces at play: supply and demand, driven by human psychology. Candlesticks, with their open, high, low, and close (OHLC) data, offer a visual representation of this constant tug-of-war. Unlike simple line charts, each candle encapsulates a period of trading activity, revealing the intensity of buying or selling pressure. A long wick, for instance, signifies a price level that was strongly rejected, while a large body indicates a period of significant price movement. Mastering this visual language is not just about pattern recognition; it's about dissecting the market's sentiment on a granular level. For serious investors, this translates directly into a more informed risk-reward assessment, a critical factor in long-term capital preservation and growth. The insights gained here are paramount for anyone looking to optimize their trading strategy and avoid the common pitfalls that plague amateur traders, significantly impacting their potential ROI.

Decoding 'Strength' Candles: Identifying Bullish and Bearish Dominance

The first critical narrative a candlestick tells is about inherent strength – whether bullish or bearish. These are the candles that clearly define the prevailing sentiment within a specific trading period. A long, green (or white) body, especially with little to no upper wick, is a powerful signal of bullish strength. It suggests that buyers entered the market aggressively and pushed prices significantly higher, closing near the period's high. Conversely, a long, red (or black) body with a short or absent lower wick indicates strong bearish conviction. Sellers have exerted dominance, driving the price down to its lowest point for that period. Understanding these signals is foundational for identifying potential trends and entry points. For instance, a series of strong bullish candles in an uptrend can signal further upward momentum, suggesting a opportune moment to consider entering long positions or increasing existing ones. Conversely, repeated strong bearish candles can highlight potential shorting opportunities or the need to exit long positions to protect capital. This fundamental interpretation is the bedrock upon which more complex trading strategies are built, influencing everything from day trading to long-term asset allocation.

Recognizing 'Control Shift' Candles: Spotting Reversals and Momentum Breaks

Markets are not static; they are in a perpetual state of flux. Identifying when control begins to shift from one faction to the other is where true trading acumen lies. 'Control Shift' candles are the harbingers of potential reversals or significant momentum changes. Patterns like the hammer, hanging man, shooting star, and inverse hammer are prime examples. A hammer, appearing after a downtrend, suggests that despite selling pressure, buyers stepped in forcefully to drive the price back up, potentially signaling the end of the bearish trend. The inverse hammer shares similar implications. On the flip side, a shooting star after an uptrend, characterized by a long upper wick and a small body, indicates that buyers pushed prices up initially, but sellers overwhelmed them, forcing the price lower by the period's close. This is a potent warning sign of potential bearish reversal. Analyzing these formations in conjunction with volume and broader market context is crucial for predicting shifts in market sentiment and making timely adjustments to your portfolio. The ability to spot these shifts can dramatically improve your timing on entries and exits, directly impacting your overall trading performance and profitability. Integrating this understanding into your investment strategy can lead to substantial gains by allowing you to anticipate turning points.

Understanding 'Indecision' Candles: Navigating Choppy Markets

Not every trading period results in a clear victory for buyers or sellers. These moments of uncertainty are often represented by 'Indecision' candles, characterized by small bodies and long wicks on either side. The doji is the quintessential example, appearing when the opening and closing prices are virtually the same. Other indecision patterns include spinning tops. These candles signal a stalemate; neither buyers nor sellers could gain a decisive advantage. While they don't provide a clear directional signal on their own, they are invaluable for understanding market psychology. A doji appearing after a prolonged trend can suggest that the existing momentum is waning, and a potential reversal or period of consolidation is imminent. In choppy or sideways markets, these candles reinforce the lack of clear direction. For the shrewd investor, these signals are not a cause for inaction, but rather a prompt to be more cautious, perhaps reducing trade size, tightening stop-losses, or waiting for a clearer directional bias to emerge. Understanding these nuances is key to avoiding costly trades during periods of market uncertainty. This knowledge is vital for managing risk effectively and preserving capital, especially when leveraging financial instruments with inherent volatility.

Candlesticks in Real Market Context: Beyond Individual Patterns

While individual candlestick patterns provide valuable insights, their true power is unleashed when analyzed within the broader market context. A single bullish engulfing pattern, for example, is far more significant when it appears at a major support level after a prolonged downtrend than if it appears randomly within a consolidative range. Key contextual factors include:

  • Trend Identification: Is the market in an uptrend, downtrend, or range-bound? Candlestick signals must be interpreted in alignment with the prevailing trend. A bullish signal within a strong downtrend is less reliable than one appearing at a support level.
  • Support and Resistance Levels: These are crucial price zones where past buying or selling pressure has historically caused price to stall or reverse. Candlesticks forming at these key levels carry much higher significance.
  • Volume: High volume accompanying a candlestick pattern amplifies its signal. For example, a reversal pattern on increasing volume is a stronger indication of a potential price shift than one on low volume.
  • Intermarket Analysis: Consider how related markets are behaving. For instance, changes in commodity prices or currency pairs could offer clues about the broader economic sentiment affecting your trading asset.
By synthesizing candlestick signals with these contextual elements, you move beyond simple pattern recognition to a more sophisticated understanding of market forces. This holistic approach is what separates successful traders from those who consistently underperform. Effective analysis requires integrating these views into a cohesive strategy, much like a financial analyst would prepare a comprehensive investment report. For optimal results, consider leveraging advanced charting software and real-time data feeds, which are often available through brokerage accounts or specialized financial data providers.

Building a High-Probability Trade Idea with Candlestick Reading

Combining your understanding of individual candlestick patterns with context allows you to construct high-probability trade ideas. The process is systematic:

  1. Identify the Trend: Determine the overall market direction using higher timeframes.
  2. Locate Key Levels: Pinpoint significant support and resistance zones.
  3. Wait for a Signal: Observe the price action as it approaches these levels. Look for specific candlestick patterns that suggest a reversal or continuation. For instance, in an uptrend approaching resistance, look for bearish reversal patterns. In a downtrend approaching support, watch for bullish reversal patterns.
  4. Confirm with Volume: Does the pattern occur with supportive volume? High volume on a reversal candle is a strong confirmation.
  5. Define Risk and Reward: Use the candlestick pattern to help set your stop-loss (e.g., just below the low of a bullish reversal pattern) and identify a potential profit target based on the next significant resistance or support level.
  6. Execute and Manage: Enter the trade with a well-defined risk management plan. Monitor the trade as it progresses, adjusting stops as necessary.
This structured approach transforms candlestick reading from a theoretical exercise into a practical tool for executing informed trades. It's about creating a repeatable system that leverages market inefficiencies and minimizes exposure to random price action. Think of it as conducting due diligence on every potential trade, much like a venture capitalist would scrutinize a business plan. For serious traders, integrating this into their workflow can lead to substantial improvements in their win rates and overall profitability. Utilizing a robust trading platform with advanced analytical tools can further streamline this process.

Advanced Strategies and Continuous Learning

While mastering basic candlestick patterns is a crucial first step, the journey to becoming a consistently profitable trader involves continuous learning and the integration of advanced strategies. Consider exploring concepts like:

  • Ichimoku Kinko Hyo: A comprehensive indicator providing support, resistance, and trend direction.
  • Elliott Wave Theory: A method of analyzing market cycles based on fractal patterns.
  • Fibonacci Retracements and Extensions: Tools for identifying potential price reversal levels and targets.
  • Order Flow Analysis: Examining the actual buy and sell orders to gauge real-time market sentiment.
Furthermore, backtesting your strategies meticulously and understanding statistical probabilities are essential. Tools like MetaTrader 5 or TradingView offer robust backtesting capabilities. Investing in high-quality trading education, such as advanced courses or mentorship programs, can accelerate your learning curve. Many platforms offer free demo accounts, allowing you to practice these advanced techniques without risking real capital. Remember, the market is an ever-evolving entity, and staying ahead requires a commitment to lifelong learning and adaptation. For those serious about amplifying their financial results, exploring specialized financial advisory services or algorithmic trading software can also be considered, though thorough research and understanding of associated risks are paramount.

MAXIMIZE YOUR PROFITS: The Binance Opportunity

To truly capitalize on market movements and amplify your gains, exploring robust platforms designed for diverse trading strategies is essential. Binance stands out as a global leader, offering a comprehensive ecosystem for both novice and experienced traders. Whether you're interested in spot trading, leveraging advanced derivatives, or earning passive income through staking and yield farming, Binance provides the tools and liquidity to execute your strategies effectively. Understanding how to navigate these platforms and utilize their features can significantly enhance your ability to profit from market opportunities, including those presented by candlestick pattern analysis. Integrating Binance into your trading arsenal means accessing a vast array of assets and sophisticated trading tools, all within a single, secure environment. This platform can be instrumental in executing trades identified through detailed candlestick analysis with efficiency and competitive fees.

Your Action Plan: Mastering Candlestick Analysis

Your Mission: Implement Candlestick Analysis in Your Trading Strategy

Knowledge is only valuable when applied. Your mission, should you choose to accept it, is to begin integrating candlestick analysis into your trading workflow immediately. Here's your actionable plan:

  1. Deep Dive into Patterns: Dedicate 30 minutes daily for the next week to study each major candlestick pattern. Create flashcards or a digital cheat sheet.
  2. Chart Practice: Open a demo trading account or a charting platform (like TradingView) and actively look for the patterns you've learned. Mark them on at least two different charts (e.g., EUR/USD daily and BTC/USD 1-hour).
  3. Contextualize: For each pattern you identify, note the trend, and any nearby support or resistance levels. Does the pattern align with the context, or does it suggest a potential reversal?
  4. Formulate a Trade Idea: Based on a well-contextualized candlestick signal, outline a hypothetical trade: entry point, stop-loss, and profit target.
  5. Review and Refine: At the end of the week, review your findings. Which patterns were easiest to spot? Which signals provided the clearest potential trading opportunities? Adjust your focus accordingly.

By consistently practicing and applying these steps, you will systematically build the intuition and confidence required to read the market's story through its candlesticks. Remember, disciplined execution is the key to transforming this knowledge into tangible financial results. Consider this your initial training protocol; consistent application is what will forge mastery.

About the Author

El Estratega Financiero is a seasoned business consultant and market analyst with over a decade of experience empowering entrepreneurs and investors to maximize their profitability. His approach is rooted in data, systems, and relentless execution, transforming complex financial landscapes into actionable strategies for wealth creation.

Conclusion

The ability to read candlestick charts is not an esoteric art; it is a fundamental skill for any serious market participant. By understanding the narratives woven into each candle – the strength, the shifts in control, and the moments of indecision – you gain a profound advantage. This knowledge, when combined with contextual analysis and a disciplined approach to risk management, forms the bedrock of a profitable trading strategy. The markets are constantly communicating; learning to interpret this language is the first step toward making informed, high-conviction decisions that can significantly enhance your financial outcomes. Embrace the process, commit to continuous learning, and watch as the charts begin to tell you their profitable stories.

Mastering Crypto Trading: Your Ultimate Technical Analysis Blueprint for Expert Profits


The cryptocurrency market presents unprecedented opportunities for those who can decipher its inherent volatility and predict its movements. While many are drawn by the allure of quick profits, sustainable success hinges on a deep understanding of market dynamics. This isn't about luck; it's about strategy. Technical analysis is your compass in this complex terrain, transforming raw price data into actionable intelligence. This comprehensive guide will equip you with the essential skills to navigate crypto markets like a seasoned expert, moving beyond speculation to strategic investment.

Advertencia de Riesgo: La siguiente estrategia implica un riesgo significativo de pérdida de capital. El trading de criptomonedas es altamente especulativo y no es adecuado para todos los inversores.

In the volatile world of cryptocurrency, mastering technical analysis is not just an advantage—it's a necessity for survival and profitability. Many enter the market with unrealistic expectations, only to be swept away by the price fluctuations. The true path to consistent gains lies in understanding the patterns and indicators that have guided traders for decades, adapted to the unique characteristics of digital assets. This blueprint is designed to transform you from a novice observer into a confident, strategic trader capable of identifying high-probability opportunities and managing risk effectively.

Candlestick Patterns: The Foundation of Price Action

Candlestick charts offer a visual narrative of market sentiment, revealing the interplay between buyers and sellers. Understanding these patterns is your first critical step towards deciphering price action. Each candle represents a specific trading period, displaying the open, high, low, and close prices.

1. Identifying Candlestick Patterns and Their Names

Mastering candlestick patterns requires diligent study. Beyond simple recognition, it's about understanding the psychology each formation represents. Patterns like the Doji, Hammer, Engulfing patterns, and Morning/Evening Stars are not just indicators; they are signals interpreted by millions of traders globally, influencing market movements. Learning to identify them accurately is paramount. For a deeper dive into pattern recognition and their implications, consider exploring resources on chart pattern analysis.

2. Trading with Candlestick Patterns

The true value of candlestick patterns lies in their application. A bullish pattern forming at a support level, for instance, signals a potential upward reversal, offering an excellent entry point for a long position. Conversely, a bearish pattern near resistance suggests a potential downturn. Successfully trading these patterns involves combining them with other analytical tools to confirm signals and enhance probability. Understanding when to act and when to wait is the mark of a disciplined trader. Explore advanced strategies on trade execution to refine your approach.

3. Setting Stop-Loss and Take-Profit Orders

No trading strategy is complete without robust risk management. Candlestick patterns help define logical levels for stop-loss orders, protecting your capital from adverse price movements. Similarly, they can indicate potential take-profit targets. A well-placed stop-loss minimizes potential losses, while a clear take-profit target locks in gains, ensuring that your trading strategy is both profitable and sustainable. This practice is fundamental to managing your risk effectively.

Mastering Trend Lines: Navigating Market Direction

Trend lines are fundamental tools for identifying the direction and strength of a market's movement. They connect a series of prices to visualize an uptrend or downtrend, providing a dynamic support or resistance level.

1. Drawing and Identifying Uptrend and Downtrend Lines

An uptrend line connects a series of higher lows, visually representing an upward price trajectory. A downtrend line connects a series of lower highs, indicating a downward trajectory. Accurate drawing of these lines is crucial. A poorly drawn trend line can lead to false signals and costly mistakes. For beginners, practicing drawing these lines on historical charts can significantly improve accuracy. This skill is a cornerstone of any market analysis strategy.

2. Trend Line Body to Body

Connecting the bodies of the candlesticks is a common method for drawing trend lines. This approach emphasizes the significant price points where buying or selling pressure was dominant during the trading period. It provides a general sense of the trend's direction and strength.

3. Trend Line Wick to Wick

Alternatively, trend lines can be drawn connecting the wicks of the candlesticks. This method captures the extreme price points reached during a trading period. Some traders prefer this approach as it can highlight potential turning points more sensitively, especially in volatile assets like cryptocurrencies. Choosing the right method often depends on the trader's style and the specific market conditions.

Support and Resistance: Pillars of Price Levels

Support and resistance levels are critical price zones where the direction of an asset's price is likely to change. Identifying these levels is vital for understanding potential market turning points and making informed trading decisions.

1. Identifying Support and Resistance Levels

Support is a price level where demand is strong enough to prevent a price from falling further. Resistance is a price level where selling pressure is strong enough to prevent a price from rising further. These levels can be identified by historical price action, round numbers, or trend lines. Understanding these zones is key to anticipating reversals and breakouts. For advanced insights, explore how to incorporate volume analysis with support and resistance.

2. Identifying Cross-Body Levels

Cross-body levels refer to price points where the body of one candlestick interacts with the body of another, often indicating a zone of indecision or a potential area of consolidation. These can be particularly significant when they align with established support or resistance zones.

3. Identifying Breakouts

A breakout occurs when the price moves decisively beyond a level of support or resistance. A true breakout suggests that the prevailing trend is likely to continue in the direction of the breakout. Traders often use breakouts as entry signals, anticipating further price movement.

4. Identifying Fake Breakouts

Fakeouts, or false breakouts, occur when the price briefly moves beyond a support or resistance level but then reverses, trapping traders who entered positions based on the initial breakout. Recognizing fakeouts is crucial to avoid significant losses. They often occur in highly volatile markets like crypto and require confirmation through other indicators or patterns.

Price Action Patterns: Predicting Market Shifts

Price action patterns are formations on a chart that suggest the future direction of price movements. They are a direct reflection of the supply and demand forces at play.

1. Bullish Patterns (Going Up)

Bullish patterns indicate a potential increase in price. Examples include the bullish engulfing, hammer, and ascending triangle patterns. When these patterns appear, especially after a downtrend or at a support level, they signal a strong possibility of upward price movement.

2. Bearish Patterns (Going Down)

Bearish patterns suggest a potential decrease in price. Examples include the bearish engulfing, shooting star, and descending triangle patterns. These formations, particularly when occurring after an uptrend or at a resistance level, signal a likely downward price movement.

3. Reversal Patterns

Reversal patterns mark a potential end to an existing trend and the beginning of a new one. They are critical for traders looking to capitalize on major market shifts. Head and shoulders, double tops/bottoms, and falling/rising wedges are classic examples of reversal patterns.

4. Continuation Patterns

Continuation patterns suggest that an existing trend is likely to resume after a brief pause or consolidation. Flags, pennants, and symmetrical triangles are common continuation patterns. Identifying these allows traders to enter positions in the direction of the prevailing trend.

Fibonacci Retracement: Unlocking Potential Entry Points

The Fibonacci sequence, when applied to trading, provides powerful tools for identifying potential support and resistance levels, helping traders pinpoint optimal entry and exit points.

1. How to Place Fibonacci on Exact Levels?

Fibonacci retracement levels are typically drawn between a significant high and low of a price move. The key levels are commonly 23.6%, 38.2%, 50%, 61.8%, and 78.6%. Precise placement requires identifying these swing highs and lows accurately on your chart. Many trading platforms offer built-in Fibonacci tools to assist with this.

2. How to Take Fibonacci Retracement (Both Sides)?

In an uptrend, traders look for pullbacks to Fibonacci support levels for potential long entries. In a downtrend, they look for rallies to Fibonacci resistance levels for potential short entries. The 50% and 61.8% levels (often referred to as the Golden Ratio) are frequently watched with particular interest.

3. How to Trade with Fibonacci Retracement?

Trading with Fibonacci involves anticipating price reactions at these key levels. When price pulls back to a Fibonacci level during an uptrend and shows signs of bouncing (e.g., a bullish candlestick pattern), it can be a signal to enter a long trade. Conversely, a rally to a Fibonacci level in a downtrend, followed by bearish signs, could signal a short entry. Combining Fibonacci with other indicators like support/resistance or trend lines can significantly increase the probability of a successful trade. For advanced applications, I recommend exploring advanced trading strategies.

The Arsenal of the Trader

Equipping yourself with the right tools and knowledge is non-negotiable for success in crypto trading. Beyond technical analysis, consider these essential resources:

  • Books: "Technical Analysis of the Financial Markets" by John J. Murphy, "Trading in the Zone" by Mark Douglas, and "The Intelligent Investor" by Benjamin Graham (for fundamental understanding).
  • Software: TradingView for charting and analysis, and reliable cryptocurrency exchange platforms like Binance.
  • Platforms: For robust charting and real-time data, TradingView is indispensable. When it comes to executing trades, a highly liquid and secure exchange is paramount. Platforms like Binance offer a comprehensive suite of tools for both beginners and advanced traders.

Binance Opportunity: Your Gateway to Crypto Wealth

To effectively implement the technical analysis strategies discussed, you need a robust and reliable platform. Binance stands as a global leader in cryptocurrency exchange, offering a vast array of trading pairs, advanced trading tools, and opportunities for passive income through features like Spot trading, Futures, and Staking.

Leveraging Binance allows you to put your newly acquired technical analysis skills to the test in a dynamic market environment. Whether you're identifying bullish candlestick patterns, drawing trend lines, or waiting for Fibonacci retracements, Binance provides the infrastructure to act swiftly on your insights. The platform's extensive educational resources and market data can further augment your trading prowess, making it an indispensable tool for any serious crypto trader aiming to maximize their returns.

Open your Binance account and start building your crypto empire today

Frequently Asked Questions

"The biggest room in the world is the room for improvement." - Often attributed to various motivational speakers. This sentiment perfectly encapsulates the journey of a trader. Continuous learning and refinement are key.

Your Action Plan: Execute and Earn

Your Mission: Validate Your Trading Strategy This Week

Knowledge without action is vanity. This week, your mission is to operationalize what you've learned. Take these concrete steps:

  1. Choose Your Focus: Select ONE technical analysis concept (e.g., Hammer candlestick signals, identifying support/resistance) that resonates most with you.
  2. Open a Demo Account: If your exchange offers a paper trading or demo account, utilize it. If not, use a charting platform like TradingView with its paper trading feature. This allows practice without risking capital.
  3. Apply and Observe: For the next 7 days, actively look for instances of your chosen concept on BTC/USD or ETH/USD charts (or any other major crypto pair). Document each instance: the time, the price, the pattern, and your hypothetical entry/exit points.
  4. Review Your Findings: At the end of the week, review your documented observations. What did you learn? Were there commonalities? How often did your pattern appear? What would have been your win/loss ratio?
  5. Refine Your Approach: Based on your review, adjust your understanding or focus. Perhaps you need to combine your chosen pattern with another indicator for better confirmation.

This focused, practical exercise will solidify your understanding far more than passive learning. Ready to take the first step towards becoming a more strategic crypto trader?

Avatar del Estratega Financiero

El Estratega Financiero is a seasoned business consultant and market analyst with over a decade of experience empowering entrepreneurs and investors to maximize their profitability. His methodology is rigorously data-driven, systems-oriented, and focused on relentless execution. He translates complex financial concepts into actionable strategies for wealth creation.

Mastering Technical Analysis: Your Complete Roadmap from Novice to Expert Trader


The financial markets are a battlefield. Success hinges not on luck, but on a robust understanding of the terrain and the tools to navigate it. For aspiring traders dreaming of consistent profitability, the mastery of technical analysis is not just beneficial; it's the bedrock upon which a sustainable trading career is built. Without it, your chances of achieving meaningful profits are astronomically low. But this is not a cause for despair. Today, we rectify that. This comprehensive guide offers a definitive strategy to demystify technical analysis, transforming you into a confident, informed trader.

Advertencia de Riesgo: The following strategy involves significant risk of capital loss. Trading in financial markets carries inherent risks, and past performance is not indicative of future results. Only invest capital you can afford to lose. Consider consulting with a qualified financial advisor and exploring robust risk management tools like stop-loss orders and appropriate position sizing. Understanding advanced trading indicators and chart patterns requires dedicated study and practice; consider platforms offering demo accounts for risk-free learning.

At its core, technical analysis is the study of price action and market trends using historical data to forecast future price movements. It’s about recognizing patterns, understanding support and resistance levels, and leveraging indicators to make educated trading decisions. This guide is your blueprint, meticulously designed to equip you with everything you need to excel.

The Strategic Advantage: Why Technical Analysis is Non-Negotiable

Many enter the trading arena with a naive optimism, hoping to strike gold through sheer luck. This approach is a fast track to financial ruin. The professionals, the ones consistently extracting value from the markets, operate on a different paradigm. They rely on data, on repeatable patterns, and on a deep understanding of market psychology. Technical analysis provides this critical edge. It allows you to identify high-probability trading setups, manage risk effectively, and crucially, detach emotion from your decision-making process. Embracing technical analysis is akin to equipping yourself with a detailed map and compass before embarking on a complex expedition – it’s essential for reaching your destination.

Your Roadmap to Technical Mastery: The Core Components

This comprehensive course is structured to build your expertise layer by layer. We'll start with the foundational elements and progressively move towards advanced strategies, ensuring a solid understanding at every stage.

1. Candlestick Charts: The Language of Price

Candlesticks are the most fundamental building blocks of technical analysis. Understanding how to read them, what each part signifies (body, wicks), and how they form in sequence is paramount. They offer a visual representation of market sentiment, revealing the battle between buyers and sellers within a specific timeframe. Mastering candlestick interpretation is the first step to deciphering the market's narrative.

2. Trending Markets: Riding the Wave

Markets rarely move in straight lines; they trend. Identifying whether the market is in an uptrend, downtrend, or trading range is crucial for aligning your strategy. Uptrends offer opportunities for long positions, downtrends for shorts, and range-bound markets require different tactical approaches. We'll explore how to identify trend strength and potential reversals, allowing you to position yourself for maximum benefit.

3. Support & Resistance: The Battlegrounds of Price

Support and resistance levels are price zones where the market has historically shown difficulty breaking through. Support acts as a floor, and resistance as a ceiling. Understanding these levels is vital for identifying potential entry and exit points, as well as defining your risk parameters. These zones are critical for strategic trade placement.

4. Indicators: Tools for Deeper Insight

Technical indicators are mathematical calculations based on price and/or volume. They can help confirm trends, signal potential reversals, and gauge market momentum. From moving averages and MACD to RSI and Bollinger Bands, each indicator offers a unique perspective. Learning to use a select few effectively can significantly enhance your analytical capabilities. For those looking to integrate these tools seamlessly into their workflow, consider exploring advanced brokerage platforms that offer integrated charting and indicator suites, such as Binance, which provides a robust suite for both traditional trading and cryptocurrency markets.

5. Candlestick Patterns: Decoding Market Psychology

Specific combinations of candlesticks form recognized patterns that often signal potential price movements. Patterns like the Doji, Hammer, Engulfing patterns, and many others offer clues about the immediate market sentiment and potential continuations or reversals. Recognizing these formations is a key skill for any technical analyst.

6. Chart Patterns: Visualizing Market Structures

Beyond individual candlesticks, larger formations emerge on price charts. Patterns such as Head and Shoulders, Triangles, Flags, and Wedges provide insights into market structure and potential breakouts or trend continuations. These patterns are powerful visual tools for forecasting future price action.

7. Breakout Patterns: Capturing Momentum

Breakouts occur when the price decisively moves beyond a defined support or resistance level, or a chart pattern. Identifying these moments of increased volatility and momentum can lead to some of the most profitable trading opportunities. We will analyze the confirmation signals and strategies for capitalizing on these significant market moves.

For a deeper dive, consider structured learning. Platforms offering comprehensive courses, like the one detailed at The Trading Channel, provide extensive modules that cover these topics in granular detail, often including live market analysis and mentorship opportunities. If you're a beginner in Forex, their specialized Forex Beginner Course is an excellent starting point.

The Estratega's Verdict: Is This a Goldmine Opportunity or a Path to Ruin?

This comprehensive training program represents a significant opportunity for traders seeking to develop a robust skillset in technical analysis. The structured approach, covering everything from foundational candlestick patterns to advanced chart formations, provides a clear path to competence. The emphasis on practical application and understanding market dynamics is precisely what separates successful traders from those who struggle. However, the inherent nature of trading means that no strategy guarantees profit. Success requires discipline, continuous learning, and rigorous risk management. For those willing to put in the work, this educational path offers a high probability of developing a profitable trading career. The key lies in diligent execution and unwavering commitment to the principles taught. Aspiring traders should leverage resources like the Pro Trader Report for ongoing market intelligence.

Your Action Plan: Implementing Technical Analysis Today

Knowledge is only valuable when applied. Here’s your immediate action plan:

  1. Review the Timestamps: Dedicate time to thoroughly watch the full course content provided, paying close attention to the timestamps for each section.
  2. Start with Candlesticks: Focus intensely on understanding candlestick charts and patterns. Practice identifying them on historical charts.
  3. Identify Support & Resistance: Begin drawing support and resistance lines on charts for various currency pairs or assets. Use the free spreadsheet provided here as a starting point for your analysis.
  4. Experiment with Indicators: Choose one or two basic indicators (e.g., Moving Averages, RSI) and learn how they interact with price action.
  5. Practice on a Demo Account: Before risking real capital, open a demo account with a reputable broker and practice executing trades based on your technical analysis. Platforms like Binance offer demo trading functionalities suitable for this.

Remember, consistency is key. The more you practice and refine your skills, the more intuitive technical analysis will become.

Maximum Visibility: Leveraging Predictive Analysis Resources

To further enhance your predictive capabilities, explore these highly valuable resources:

  • The #1 Trend Trading Technique Of All Time: Link
  • The ULTIMATE Beginners Guide To Reading a Candlestick Chart: Link (Over 2.4 million views)
  • How To Identify Powerful Support/Resistance: Link (Over 839,000 views)
  • The ULTIMATE Beginner's Guide to Price Action Trading: Link
  • Predictive Analysis 101 For Beginners: Link
  • Using Structure to Defeat the Markets: Link
  • Learn to Master Technical Analysis/ Price Action Trading: Link
  • Top 2 Best Currency Trading Indicators: Link

These resources are curated to provide you with a diverse range of perspectives and advanced techniques in predictive analysis and trading strategies.

Maximiza tus Ganancias: La Oportunidad de Binance

In the dynamic world of financial trading, having the right platform is as crucial as having the right strategy. Binance has emerged as a global leader, offering a comprehensive ecosystem for both novice and experienced traders to explore a vast array of opportunities in cryptocurrencies and beyond. Whether you are looking to engage in sophisticated trading strategies, explore the potential of staking and yield farming to generate passive income, or simply start your journey into digital assets, Binance provides the tools and infrastructure. Leveraging a robust platform like Binance can significantly amplify your ability to execute trades efficiently, manage your portfolio effectively, and capitalize on market movements. For those serious about building their financial empire, exploring the potential of cryptocurrencies and decentralized finance through a trusted exchange is a critical step. Don't let hesitancy hold you back from exploring these new frontiers of wealth creation. Take control of your financial future and discover the possibilities that await.

Abre tu cuenta en Binance y empieza a construir tu imperio cripto hoy mismo: Abre tu cuenta en Binance y empieza a construir tu imperio cripto hoy mismo

Frequently Asked Questions (FAQ)

Q1: What is the most important aspect of technical analysis for a beginner?

A1: For beginners, the most critical aspect is understanding candlestick charts and how to identify basic support and resistance levels. These form the foundation for all other analyses.

Q2: Can I become a profitable trader solely through technical analysis?

A2: While technical analysis is vital, profitability also depends heavily on risk management, trading psychology, and continuous learning. It’s a powerful tool, but not a foolproof guarantee.

Q3: How long does it typically take to master technical analysis?

A3: Mastery is a continuous journey. However, a solid understanding of the core concepts can be achieved with consistent study and practice over several months. Becoming truly proficient takes years of experience.

About The Author

Steven Hart is recognized as a top trading educator on YouTube by Feedspot.com. He became a self-made professional trader at 20 and is known as the "Honest Trading Coach" to hundreds of thousands worldwide. As the founder and CEO of The Trading Channel, Steven has dedicated over a decade to studying trading science and psychology, developing numerous rule-based trading systems and strategies used by top traders globally. He is on a mission to help 1,000 traders become independently profitable in the next 12 months.

Your Mission: Validate Your Trading Strategy This Week

Your mission, should you choose to accept it, is to actively engage with the material presented. This week, select one currency pair or asset you are interested in. Apply the principles of candlestick patterns and support/resistance to analyze its historical price action. Document your findings, identify potential trade setups, and crucially, define your entry, exit, and stop-loss levels. Even if you only use a demo account, the act of disciplined analysis and planning is the first, most critical step towards consistent profitability.

Share your initial observations or any challenging patterns you encountered in the comments below. Let's build a community of informed and disciplined traders together.